


Quantitative research methods are structured ways to collect numerical data and analyze it statistically. Researchers use them to describe trends, compare groups, examine relationships, make predictions, and test whether one variable affects another.
Here’s the problem: the word “method” gets stretched to cover too much. In this guide, I’ll keep things separate and clear.
We’ll cover research designs, data collection methods, statistical analysis methods, practical examples, and criteria for choosing the right approach for your study.
Quantitative research does rest on measurable variables and numbers, that part is simple. But your design still has to match your research question, or your results won’t generalize the way you want them to.
What are quantitative research methods?
Quantitative research methods are structured ways to collect numbers and analyze them with statistics. They rely on measurable variables, numerical data, standardized procedures, and statistical analysis to keep results consistent and comparable.
These methods serve four main goals: describe a pattern, compare groups, examine relationships between variables, and test whether one variable affects another.
For example, a researcher records how many hours students study each week, then compares those numbers with their exam scores. That’s quantitative research in action.
One thing to keep in mind: numbers alone don’t make a study accurate or unbiased. Quality still depends on your sample, your measurements, your design, and how you interpret the results. Good data can still produce a weak study if any of those pieces slip.
What is quantitative research used for?
Quantitative research is used when a researcher needs measurable evidence about the frequency, size, relationship, difference, prediction, or effect of something.
Here are the main use cases. You can find out how many people share a certain characteristic. You can measure how often something happens. You can compare two or more groups. You can test the relationship between variables. You can predict an outcome based on other variables. You can also evaluate the effect of a program, treatment, or intervention.
A few real questions show this best:
- How many students use AI tools each week?
- Is study time related to exam performance?
- Do online and in-person students report different stress levels?
- Does a new study program improve test scores?
These questions usually fall into three types: descriptive, associative, or causal. Your goal shapes your design, so nail down your question first.
What are the main characteristics of quantitative research?
Quantitative research shares a few core traits, no matter the topic or field.
- Measurable variables: concepts get turned into concrete indicators you can actually track.
- Numerical data: results can be counted and compared side by side.
- Structured procedures: the same rules apply to every participant, no exceptions.
- Defined population and sample: you know exactly who’s being studied.
- Statistical analysis: used to describe patterns or test them.
- Reliability and validity checks: measurement quality gets evaluated, not assumed.
- Transparent reporting: the sample, instrument, analysis, and limitations all get spelled out.
One thing I won’t tell you: that quantitative research is completely objective and free from bias. It isn’t. Standardization cuts down on some subjectivity, sure, but sampling bias, measurement bias, and misinterpretation are still very much possible.
How do you use quantitative research step by step?
Follow these seven steps to run a quantitative study from start to finish.
- Define the research problem. Decide what you need to describe, compare, or test.
- Review existing research. Look at past studies, theories, and ways others measured the same thing.
- Write a research question or hypothesis. State your question using variables you can measure.
- Operationalize the variables. Decide exactly how you will measure each concept.
- Choose a research design and sample. Pick correlational, quasi-experimental, or experimental, then pick who you’ll study.
- Collect and analyze the data. Use a standardized tool and the right statistical method.
- Interpret and report the findings. Explain your results honestly. Don’t claim causation you can’t prove, and list your limits.
The steps flow in one direction:
Your question should drive every choice after it. Don’t pick a design or a statistical test just because it sounds impressive. Pick the one that actually fits what you’re asking.
What is the difference between a research design, data collection method, and analysis method?
A research design sets the overall logic of a study. A data collection method decides how you gather your information. An analysis method decides how you examine the numbers you collected.
This is where most students get stuck. They pick a design and think they’re done, then realize “survey” isn’t a design at all. It’s a collection method. This is how the pieces actually break down.
| Research Component | What It Answers | Examples |
|---|---|---|
| Research design | How will the study answer the research question? | Descriptive, correlational, causal-comparative, quasi-experimental, experimental |
| Data collection method | How will the researcher obtain the data? | Survey, structured interview, observation, standardized test, existing dataset |
| Analysis method | How will the numerical data be examined? | Percentages, correlation, regression, t-test, ANOVA, chi-square |
| Instrument or tool | What specific instrument will measure the variable? | Questionnaire, rating scale, test, sensor, spreadsheet, statistical software |
These four pieces work together, not alone. Here’s what that looks like in practice: a researcher picks a correlational design, gathers data through an online questionnaire, then analyzes the relationship between variables with regression. One study, four decisions, each one separate.
What are the main types of quantitative research methods?
The main quantitative research designs are descriptive, correlational, causal-comparative, quasi-experimental, and experimental. Surveys and observations aren’t designs at all. They’re ways to collect data. Cross-sectional and longitudinal aren’t designs either. They just describe when you collect your data.
| Design | Main Purpose | Researcher Introduces an Intervention | Random Assignment | Appropriate Causal Claim | Simple Example |
|---|---|---|---|---|---|
| Descriptive | Describe a population or phenomenon | No | No | No | Measure average weekly screen time |
| Correlational | Examine relationships | No | No | No | Compare study hours with grades |
| Causal-comparative | Compare pre-existing groups | No | No | Limited, not proven | Compare outcomes of online and campus students |
| Quasi-experimental | Evaluate an intervention without full randomization | Yes | Usually no | Stronger but limited | Introduce a program in one existing class |
| Experimental | Test cause and effect under controlled conditions | Yes | Usually yes | Strongest among these designs | Randomly assign students to two study programs |
Some textbooks split these differently. That’s fine. This five-part structure still gives you a clean way to separate observing, comparing, and actively intervening.
What is descriptive quantitative research?
Descriptive research measures frequencies, percentages, averages, and trends. You don’t manipulate anything here. You just observe and count.
It fits questions like “how many,” “how often,” and “what percentage.” A survey of weekly student screen time is a good example.
One limit: it tells you what’s happening, not why.
What is correlational quantitative research?
Correlational research measures the strength and direction of a relationship between variables. You don’t control those variables experimentally. Sleep duration and GPA is a classic example.
Remember this: correlation does not prove causation. A strong link doesn’t mean one thing causes the other.
What is causal-comparative research?
Causal-comparative research compares groups that already exist. You don’t introduce any intervention. This design also goes by another name: ex post facto research. Comparing academic results of students who work jobs and those who don’t is one example. Watch out for confounding variables. Other factors could explain the difference just as easily.
What is quasi-experimental research?
Quasi-experimental research does introduce an intervention, but without full random assignment. Researchers often use existing classrooms, hospitals, or communities instead of building a fresh sample.
Say one school rolls out a new curriculum while another doesn’t. That’s quasi-experimental. The difference from causal-comparative design comes down to the intervention: quasi-experimental adds one, causal-comparative doesn’t.
What is experimental quantitative research?
Experimental research manipulates an independent variable and measures its effect on a dependent variable. It uses a control or comparison group. Random assignment happens whenever possible. A randomized study comparing two learning strategies is a textbook example.
Do all quantitative designs provide the same strength of evidence?
No. Experimental control usually strengthens causal inference the most. But correlational design isn’t “weak” if your question is about a relationship, not a cause. Descriptive design is the right tool for measuring prevalence, nothing more, nothing less.
The best design isn’t the most complex one. It’s the one that fits your research question.
You should also weigh internal validity and external validity separately. And remember: even a strong experimental label can’t fix weak measurement, a bad sample, or sloppy execution.
Is survey research a quantitative method or a research design?
A survey is a data collection method, not a full research design. You can use the same survey inside a descriptive, correlational, cross-sectional, longitudinal, or even experimental study.
This matters for one reason. Closed-ended questions give you numerical data. Rating scales measure attitudes or behaviors. Open-ended questions give you qualitative responses instead. That means one questionnaire can support quantitative research, or mixed-methods research, depending on how you build it.
You’ll see the phrase “survey research design” in academic sources. It’s not wrong, exactly, but it’s incomplete. If you use that term, spell out four things: your purpose, your timing, your sampling, and your analysis method. Otherwise a reader can’t tell what kind of study you actually ran.
What is the difference between cross-sectional and longitudinal research?
Cross-sectional research collects data at one point in time. Longitudinal research collects data repeatedly, over weeks, months, or years.
| Feature | Cross-Sectional Research | Longitudinal Research |
|---|---|---|
| Timing | Data collected at one main point | Data collected repeatedly over time |
| Best for | Current prevalence, differences, associations | Change, development, long-term trends |
| Example | Survey students once during the semester | Survey the same students every semester |
| Main limitation | Cannot show individual change over time | More expensive and vulnerable to participant dropout |
One thing to clear up: these terms describe time structure, not proof of causation. Longitudinal data can track sequence and change better than a single snapshot. But tracking change over time still doesn’t prove one thing caused another. You’d need the right design for that, not just the right timeline.
Which data collection methods are used in quantitative research?
Researchers reach for several tools to gather numerical data, and the right one depends on what you’re measuring.
- Structured surveys and questionnaires — measure attitudes, behaviors, preferences, and prevalence.
- Structured interviews — ask standardized verbal questions, then code the answers as numbers.
- Systematic observations — count behaviors or events using a checklist.
- Standardized tests and scales — measure knowledge, ability, symptoms, or attitudes.
- Physical or digital measurements — track time, temperature, heart rate, clicks, or purchases.
- Administrative records and existing datasets — pull from grades, census records, sales, or health records.
- Experimental outcome measurements — record results before and after an intervention.
What is the difference between primary and secondary quantitative data?
Primary data is collected specifically for your current study. Secondary data was already collected, either by another organization or for a different purpose entirely.
Primary data gives you more control. You choose the variables, and you choose the instrument. Secondary data is often cheaper and faster to use, but you give up control over how it was originally measured or sampled. You’re trusting someone else’s process.
How do you choose the right quantitative research method?
Pick your method based on four things: the question you need to answer, the amount of control you have, the type of data you need, and the ethical or practical limits on your study.
| Research Goal | Recommended Design | Possible Data Source |
|---|---|---|
| Describe how common something is | Descriptive, often cross-sectional | Survey, records, observations |
| Examine whether two variables are related | Correlational | Survey, tests, secondary data |
| Compare existing groups | Causal-comparative | Records, tests, questionnaires |
| Evaluate an intervention without random assignment | Quasi-experimental | Pretest and posttest measures |
| Test a causal effect under controlled conditions | Experimental | Controlled outcome measurements |
| Track change over time | Longitudinal | Repeated surveys, tests, records |
That table covers the big decision. But a few other factors shape the final call too:
- Your access to participants
- Your available sample size
- Any ethical restrictions on your study
- Your time and budget
- The quality of instruments available to you
- Whether you can introduce an intervention at all
- How much you need your results to generalize
Match your design to your question first. Then check it against this list before you commit.
How do you write a quantitative research question and hypothesis?
A strong question names your population, your measurable variables, and either a relationship or a comparison. Add a timeframe too, if it matters to your study.
Here are four templates you can adapt:
- Descriptive: What percentage of [population] experiences [measurable outcome]?
- Correlational: What is the relationship between [variable X] and [variable Y] among [population]?
- Comparative: Is there a difference in [outcome] between [group A] and [group B]?
- Causal: What effect does [intervention X] have on [outcome Y] among [population]?
Not every study needs a formal hypothesis.
Descriptive or exploratory studies often skip it entirely. Confirmatory correlational and experimental research usually need one, though. That means writing both a null hypothesis and an alternative hypothesis.
One rule matters most: your hypothesis has to be testable. “Technology affects students” isn’t a hypothesis. It’s a guess with no measurable variables attached. A real hypothesis names what you expect to happen, to whom, and how you’ll measure it.
What are variables, and how are they measured?
Four types of variables show up again and again in quantitative research:
- Independent variable — a possible predictor, or the intervention you introduce.
- Dependent variable — the outcome you measure.
- Control variable — a variable you hold steady to rule out other explanations.
- Confounding variable — a hidden factor linked to both your predictor and your outcome.
Before you measure any of these, you need to operationalize them. Operationalization just means turning an abstract concept into something you can actually measure.
| Abstract Concept | Possible Quantitative Measure |
|---|---|
| Academic performance | GPA or standardized test score |
| Study effort | Hours studied per week |
| Stress | Score on a validated stress scale |
| Social media use | Average minutes per day |
| Customer satisfaction | Rating on a defined numerical scale |
One catch: a number doesn’t guarantee good measurement. A poorly built indicator can measure precisely the wrong thing. You can collect clean, accurate data on a variable that never captured what you actually wanted to study.
How do sampling and sample size affect quantitative research?
Your population is the full group you want to draw conclusions about. Your sample is the smaller group that actually takes part in your study.
How you build that sample matters. Probability sampling gives every member of your population a known chance of being picked, which boosts your odds of a representative sample. Convenience sampling is easier to set up, but it limits how far you can generalize your results.
Sample size matters just as much. A bigger sample improves your precision, your statistical power, and the stability of your estimates. There’s no magic number here. “30 participants is enough” isn’t a real rule. The size you actually need depends on your design, your expected effect size, how much variability exists in your data, how many groups you’re comparing, and which statistical test you’ll run.
Don’t claim your results apply to “all college students” when your sample was one course, at one university. That’s overgeneralization, and it’s one of the fastest ways to weaken an otherwise solid study.
How is quantitative data analyzed?
Analysis follows a clear order, step by step:
- Check and clean the data.
- Code responses consistently.
- Describe the sample.
- Select a statistical method.
- Test assumptions where required.
- Interpret the result in relation to your research question.
- Report uncertainty and limitations.
| Research Goal | Common Analysis | Typical Output |
|---|---|---|
| Describe responses | Frequencies and percentages | Number or percentage of participants |
| Summarize numerical values | Mean, median, standard deviation | Typical value and variability |
| Examine a relationship | Correlation | Strength and direction of association |
| Predict an outcome | Regression | Estimated relationship between predictors and outcome |
| Compare two groups | t-test | Difference between group means |
| Compare three or more groups | ANOVA | Evidence of differences among group means |
| Compare categorical variables | Chi-square test | Association between categories |
A few caveats before you pick a test off this list. It shows common uses, not universal rules. The right test depends on your data type, your distribution, your design, and the assumptions each test requires.
Don’t stop at p < .05 either. Whenever you can, report the effect size, the confidence interval, and the practical significance of your result. A tiny effect can still hit statistical significance and mean almost nothing in the real world.
One more risk to avoid: running many tests without controlling for that, then reporting only the ones that came back significant. That’s how weak findings get dressed up as strong ones.

What are some examples of quantitative research?
Real quantitative research spans nearly every field. Here are six hypothetical research examples that show how the method adapts to different questions.
| Field | Research Question | Design | Data |
|---|---|---|---|
| Education | Is weekly study time related to exam scores? | Correlational | Study hours and exam scores |
| Healthcare | What percentage of adults report sleep problems? | Descriptive, cross-sectional | Survey responses |
| Psychology | Does a mindfulness program reduce anxiety scores? | Experimental or quasi-experimental | Pretest and posttest scale scores |
| Business | Does a new checkout page increase purchases? | Experimental A/B test | Conversion rates |
| Sociology | Is household income associated with voter participation? | Correlational, secondary data | Income and participation records |
| Environmental science | How have average temperatures changed over ten years? | Longitudinal descriptive | Repeated temperature measurements |
The topic alone never decides the design. Take stress as an example. You could describe how common it is. You could compare stress levels between two groups. You could link it to sleep with a correlational study. Or you could measure it before and after an intervention, like a new wellness program.
Same topic, four completely different studies. Your research question decides the design, not your subject matter.
How is quantitative research used in market research?
Marketing teams lean on quantitative research for five main jobs.
- Market size and awareness surveys — find out how many consumers know about or use a product.
- Customer satisfaction measurement — collect numerical ratings across different groups or time periods.
- A/B testing — compare ads, emails, landing pages, or checkout flows against each other.
- Pricing and preference research — measure willingness to pay or which features matter most.
- Transaction and behavioral data analysis — study purchases, clicks, retention, and repeat orders.
Which tool you reach for depends on what you need to know.
Use a survey when you need attitudes or self-reported preferences. Use an A/B test when you can control and change just one element. Pull from existing customer data when you need real behavior, not stated intentions. Use longitudinal tracking when you care about change over time, like shifting brand awareness or satisfaction.
What does a complete quantitative research example look like?
Here’s a full study broken into its parts. This is hypothetical, walked through step by step, not a real study with real results.
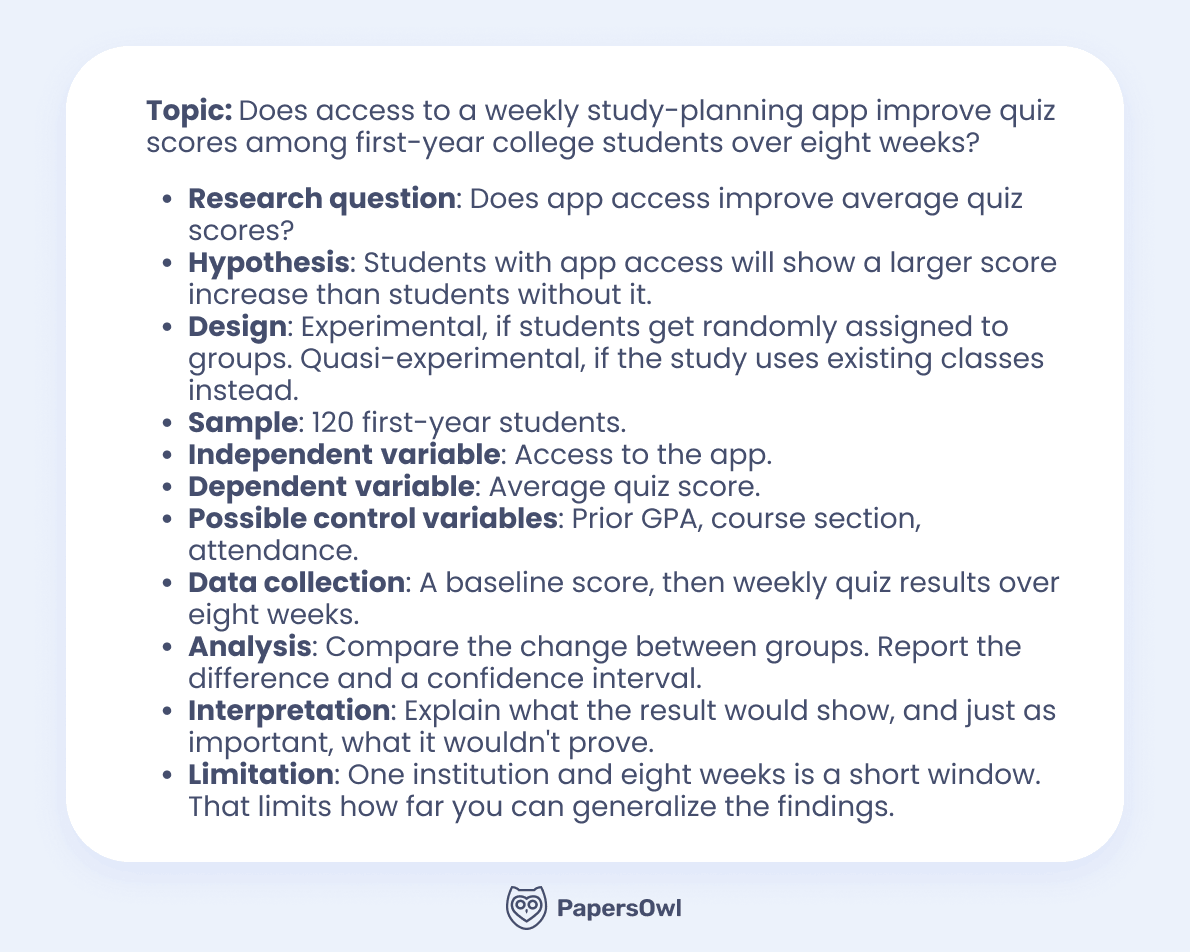
Notice what’s missing here: an actual number, like “the app increased scores by 15%.” That’s on purpose. No study was run, so no result exists to report.
What you can do, before running a study, is map out exactly how you’d interpret the result once it comes in.
What are some quantitative research paper topics?
Picking a topic is only half the job. You also need a design that fits it, so I’ve grouped these by method.
- How Often Do College Students Use AI Writing Tools (descriptive topics)
- What Percentage of Remote Workers Report Burnout Symptoms (descriptive topics)
- How Common Is Food Insecurity Among First-Generation Students (descriptive topics)
- The Relationship Between Sleep Duration and Academic Performance (correlational topics)
- Social Media Use and Self-Reported Anxiety Levels (correlational topics)
- Screen Time and Attention Span in High School Students (correlational topics)
- Academic Outcomes of Working and Non-Working College Students (causal-comparative topics)
- Stress Levels in Online Versus In-Person Learners (causal-comparative topics)
- Test Scores of Students Who Use Study Apps Versus Those Who Don’t (causal-comparative topics)
- The Effect of a New Curriculum on One School’s Test Scores (quasi-experimental topics)
- Impact of a Wellness Program on Employee Attendance (quasi-experimental topics)
- The Effect of Study Method on Exam Performance (experimental topics)
- Does a Mindfulness App Reduce Reported Stress Scores (experimental topics)
- Changes in Student Engagement Over a Four-Year Degree (longitudinal topics)
- Tracking Customer Satisfaction Across a Product’s First Year (longitudinal topics)

What do annotated quantitative research examples look like?
Here are three short, worked examples. Each one shows how a topic turns into a real design.
Example 1: Caffeine and focus
Research question: Is there a relationship between caffeine intake and self-reported focus during study sessions? Design: Correlational. A researcher would track daily caffeine intake and pair it with a focus rating, then look for a pattern between the two.
Example 2: Peer tutoring and midterm grades
Research question: Does introducing peer tutoring in one dorm improve midterm grades compared to a dorm without it? Design: Quasi-experimental, using existing dorm groups rather than random assignment. One dorm gets tutoring, the other doesn’t, and the researcher compares grade changes.
Example 3: Citation software use among graduate students
Research question: What percentage of graduate students use citation management software? Design: Descriptive, cross-sectional. A single survey captures how common the practice is right now, with no comparison group involved.
What is the difference between qualitative and quantitative research methods?
Quantitative research measures variables with numbers and statistics. Qualitative research explores experiences, meanings, and processes through non-numerical material like interviews, observations, or documents.
| Feature | Quantitative Research | Qualitative Research |
|---|---|---|
| Main goal | Measure, compare, test, predict | Explore meaning, experience, context |
| Data | Numbers and coded measurements | Words, narratives, images, observations |
| Typical sample | Often larger and standardized | Often smaller and purposefully selected |
| Common tools | Surveys, tests, scales, datasets | Interviews, focus groups, field notes |
| Analysis | Statistical | Thematic, narrative, content-based |
| Typical question | How many? Is there a relationship? | How? Why? What does it mean? |
| Example | How many students experience test anxiety? | How do students describe test anxiety? |
The difference goes deeper than just the data format. These two approaches also differ in the type of question they answer, how they sample participants, how they measure things, and how they analyze what they find.
When should you use mixed methods?
Sometimes numbers alone don’t tell the full story.
A quantitative phase shows you the scale or the pattern, like how many students report test anxiety. A qualitative phase then explains the possible reasons behind that pattern.
Reach for mixed methods when numbers alone feel incomplete, and narratives alone feel unproven.
What are the advantages and limitations of quantitative research?
Quantitative research comes with real strengths and real trade-offs, and both depend heavily on how well you run the study.
| Advantages | Limitations |
|---|---|
| Makes groups and trends easier to compare | May reduce complex experiences to limited measures |
| Supports standardized data collection | Poorly designed instruments can introduce bias |
| Can include large samples | Large samples are not automatically representative |
| Allows statistical hypothesis testing | Statistical association may be mistaken for causation |
| Makes procedures easier to replicate | Results may lack contextual explanation |
| Can support population estimates | Generalization depends on sampling and design |
Quantitative research isn’t automatically “better” or “more accurate” than qualitative research. Its strengths only show up under the right conditions.
Your variables need to be operationalized correctly. Your sample needs to actually match your population. Your data collection needs to stay consistent. Your analysis needs to fit your design. And your conclusions can’t reach further than your evidence actually supports.
Skip any one of those, and the advantages in that left column stop applying.
How do you ensure reliability, validity, and reduce bias?
Four concepts protect the quality of your study.
- Reliability is consistency: does your measurement give you the same result under the same conditions
- Construct validity asks whether your instrument actually measures the concept it claims to measure.
- Internal validity asks how convincingly your study supports a causal conclusion.
- External validity asks how well your results transfer to other populations or settings.
A few practical steps strengthen all four:
- Use previously validated instruments when they exist.
- Pilot-test your questionnaire before the real study.
- Avoid leading or ambiguous questions.
- Define your variables before you start collecting data.
- Train observers or data collectors so everyone follows the same rules.
- Keep your procedures consistent from start to finish.
- Select a sample that actually fits your population.
- Use random assignment or control groups whenever you can.
- Document any exclusions or missing data.
- Predefine your main analysis before you see the results.
- Report your limitations and any alternative explanations.
What common quantitative research mistakes should you avoid?
- Treating correlation as proof of causation.
- Claiming that p < .05 proves your hypothesis.
- Reading a nonsignificant result as proof of no effect.
- Generalizing from an unrepresentative sample.
- Running many tests and reporting only the favorable ones.
- Measuring a complex concept with a question that’s too simple for it.
- Ignoring missing data or participant dropout.
- Using causal language to describe observational research.
These aren’t small technicalities. Measurement quality, construct validity, response bias, causal overstatement, and leaning too hard on p-values are some of the biggest risks in quantitative research, and they’re also some of the easiest to fix once you know to look for them.
How can you find credible quantitative research studies?
Finding real, peer-reviewed studies takes a few deliberate steps.
- Start with Google Scholar or a university library search.
- Pick a subject database that fits your field.
- Combine your topic with methodological terms, like quantitative, survey, cross-sectional, longitudinal, correlational, experiment, randomized, regression, or statistical analysis.
- Apply a peer-reviewed filter, if the database offers one.
- Read the abstract and the methods section first, before anything else.
- Look for the sample, the variables, the research design, the data collection instrument, and the statistical analysis.
- Check the publication date, the journal, the DOI, and any listed limitations or corrections.
Try search strings like this: “college student stress” AND quantitative AND survey. Or this: “online learning” AND academic performance AND longitudinal.
How can you tell whether a study is quantitative?
Look for a few clear signs.
A quantitative study defines numerical variables and states its sample size upfront. It follows a structured measurement procedure and runs statistical tests. You’ll usually find tables or numerical results, plus terms like mean, percentage, correlation, regression, or confidence interval.
Peer-reviewed filtering narrows your search fast, and university research guides also recommend checking the data collection method, any secondary data used, the analysis, and the software separately. One caution, though: peer-reviewed status is a starting filter, not a guarantee of quality on its own.
What should you remember about quantitative research methods?
The best method is simply the one that fits your question. It measures what you actually intend to measure, and it supports only the conclusions your data can justify.
Start with your question. Then choose your design, pick your sample and data collection method, and only after that, decide how to analyze your results. Order matters here.
Question → Design → Sample → Measurement → Analysis → Conclusion
Follow that order, and the rest of this guide falls into place.
1. Main types/designs (descriptive, correlational, experimental)
NIH/NCBI — “Overview of Quantitative Research” (PMC)
https://pmc.ncbi.nlm.nih.gov/articles/PMC12969534/
2. Hierarchy of evidence / internal & external validity
Slater & Hasson, “Quantitative Research Designs, Hierarchy of Evidence and Validity” — peer-reviewed, Ulster University, published 2024, DOI 10.1111/jpm.13135
https://pmc.ncbi.nlm.nih.gov/articles/PMC12056466/
3. Correlational research methods
NCBI Bookshelf — “Chapter 12: Methods for Correlational Studies”
https://www.ncbi.nlm.nih.gov/books/NBK481614/
4. Reliability and validity — practical guide
Colorado State University, Writing@CSU — “Understanding Reliability and Validity”
https://writing.colostate.edu/guides/pdfs/guide66.pdf
5. P-values, effect size, statistical significance
Scribbr — “Reporting Statistics in APA Style” (APA 7th ed. guidelines)
https://www.scribbr.com/apa-style/numbers-and-statistics/
6. Qualitative vs quantitative — university comparison
Illinois Institute of Technology, LibGuides — “Quantitative vs. Qualitative Research”
https://guides.library.iit.edu/c.php?g=1481358&p=11040919
7. Finding quantitative studies — library resource
University of Phoenix Library — “Find Quantitative and Qualitative Research”
https://library.phoenix.edu/find_quantitative_and_qualitative_research